 Join the network
Blog
Measuring inequality in middle-income countries
Income inequality is the result of complex processes with multiple interacting driving forces but understanding those drivers in emerging economies is particularly difficult because of data and analytical challenges. While most middle-income countries produce comprehensive household surveys these are subject to limitations. It can, for instance, be difficult to get accurate information — or any information — about the richest and poorest in a society. And so it is necessary to hone our analytical methods and to combine the information provided by surveys with data from alternative sources.
This led UNU-WIDER to study five countries, representing 40 percent of the world’s population, under the Inequality in the Giants project: Brazil (led by Marcelo Neri), China (Li Shi), India (Peter Lanjouw), Mexico (Nora Lustig), and South Africa (Murray Leibbrandt).
Here are some examples of the strategies used in the project that might help to shape the debate on how to measure inequality in middle-income countries.
Correcting for missing values
The project showed the importance of correcting for zero incomes or missing values in surveys. While these corrections had virtually no effect on the well-known downward trend in income inequality in Brazil, they were crucial in showing that earnings inequality did not decline in Mexico after 2006.
Labour income
The Mexico team combined labour force surveys with information from national accounts on wages, employment, etc., to show that the lagging productivity of the informal non-tradable sector — such as construction, retail, and other services — explained the falling share of labour in national income.
In Brazil, a panel of social security records (RAIS) was used to more accurately represent the earnings distribution and worker characteristics over time. This proved to be especially useful in identifying the role of the large differences between firms in explaining the level, but also the fall, in earnings inequality before the last economic recession. It also helped to show that this decline in inequality was accompanied by a rise in earnings among the richest workers. Differences in occupation, industry and firms were shown to explain the gender wage gap over the life cycle too. It is important to note that using social security data effectively misses the large and informal sector in developing countries, which is an obvious limitation of this approach.
Taxes and benefits
The redistributive impact of taxes and benefits were analysed using different strategies. While the South Africa team investigated the effect on inequality of direct taxes and cash transfers using survey data, in Mexico the team added information from public accounts in order to account for in-kind benefits and adjust for income under-reporting. A tax-benefit microsimulation model was used in Brazil.
These exercises allowed the researchers to identify the important but declining contribution of public policies in shaping the income distribution of developing countries, as well as their limitations in offsetting earnings inequality.
Estimating top incomes
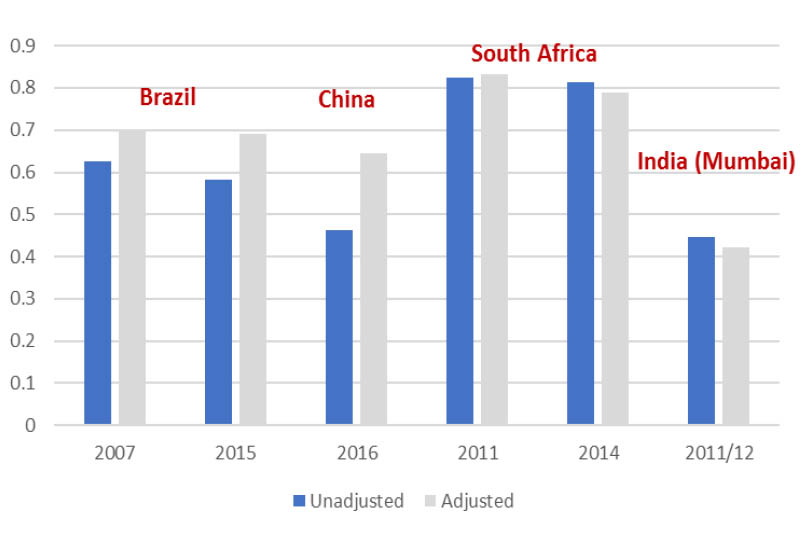
Various strategies combining surveys with other sources allowed researchers to correct for the underestimation of top incomes. A smaller decline in inequality was found in Brazil using personal income tax tabulations, although these results might be driven by changes in the size and composition of the tax base rather than in actual incomes.
The use of a panel dataset with individual tax records in South Africa did not, surprisingly, change very much income inequality trends, although this might be driven by particularities the design of the survey.
The Chinese team used a database combining information from different lists of super-rich people, showing that inequality is much higher than usually reported. On the contrary, no impact on inequality was found in Mumbai (India) after combining expenditure information with online house price listings.
Unique data sources
In a final example, the India team combined household surveys with census and satellite data on night-time luminosity, precipitation, etc., to estimate average per capita expenditure across small areas. They showed that the increase in inequality over time was mostly due to rising inequality within urban blocks, rather than between them.
In summary, household surveys will continue to be the main source of distributive information in middle-income countries, but we need to be extremely careful to assess the impact of issues like non-response, the under-representation of certain population groups, or the lack of precise information to analyse patterns in earnings across small areas. We need to use complementary data sources and approaches, but this raises questions about the quality of new data sources and the methods to integrate them. This research is an important step in that direction.
This blog was written as part of the recent HDRO Symposium on Measuring Inequality in the 21st Century, which was organized in partnership with the LIS Cross-National Data Center, the Stone Center on Socio-Economic Inequality at the City University of New York, UNU-WIDER, and the World Inequality Lab. To learn more on the Symposium, please visit here.
This post was first published by HDialogue blog. Read the original article.
The views expressed in this piece are those of the author(s), and do not necessarily reflect the views of UNDP/HDRO, UNU-WIDER or the United Nations University, nor the programme/project donors.