 Join the network
Blog
Detecting global income inequality trends
And why it matters
More accurate estimates of inequality trends allow us to measure progress towards achieving reductions in inequality within and between countries. Deviations in trend patterns can provide insights for further explorations of the root causes and consequences of varying degrees of economic inequality.
Inequality persists to the present day. However, when, where, and how it evolved is not a straightforward answer. As it is a complex phenomenon, how we understand and define it influences our estimates of levels and trends of inequality. While we have well-established measures, such as the Gini coefficient, there are still challenges to establishing databases that facilitate comparisons of inequality across space and time.
Typically, estimations of income inequality have been based on household surveys. These data sources impose certain challenges to the accuracy of our estimates. For example, households tend to underestimate certain sources of income, or sampling designs only represent certain groups of a country’s population. However, the accuracy of income measurement can be improved, as evidenced by recent advances in data coverage, quality, and access now leading to efforts to compile information across countries. The World Income Inequality Database (WIID) constitutes one such effort.
Recent trends in income inequality
Using the WIID database, a report by the UN Economist Network (UNEN) provides an overview of both the variety as well as patterns of inequality trends. This includes global income inequality as well as within-country income inequality. Global measures treat every individual of the world's population — regardless of their nationality — as a single cohort. Within-country income inequality measures estimate inequality among only the individuals of a single country's population.
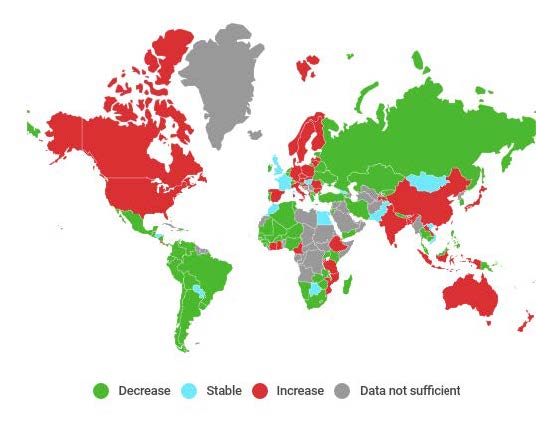
Global measures of income inequality seem to decline from the 1990s, but are still very high. The global Gini index has been estimated at 62.3 in 2010 which is well above within-country inequality for most countries. During the 1990s and up until the mid-2010s, a higher number of countries saw a decline in income inequality (68 countries), than rising inequality (45 countries). However, more individuals experienced increasing inequality as the 45 countries with rising inequality represent 58% of the global population.
Figure 1: Map of within-country inequality changes between around 1990 and the mid-2010s, GINI Index.
Trend conversion
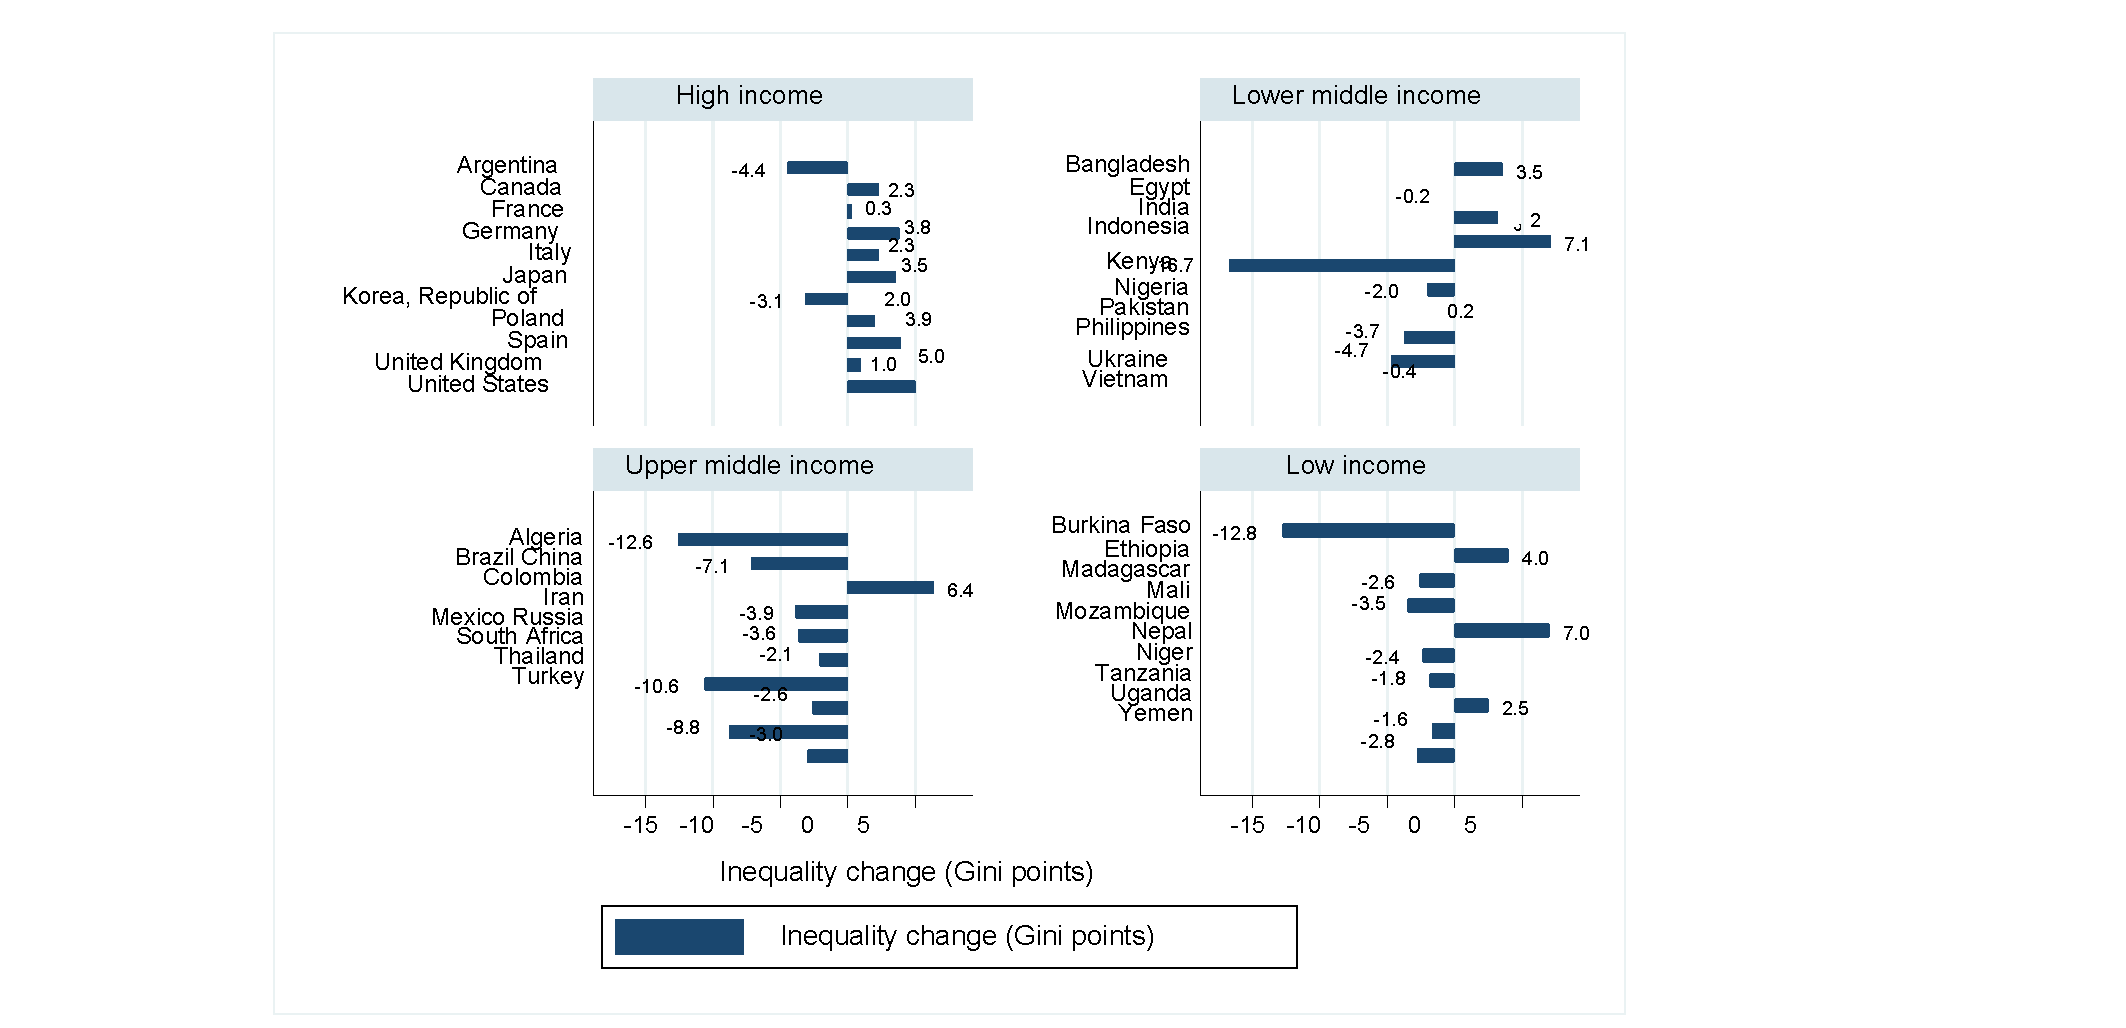
As UNEN’s report observes, inequality dynamics speak to a conversion in inequality trends. Conversion in this case means that countries with different levels of inequality witness opposite trends. Those with low levels of inequality tend to experience a rise, while those with high levels of inequality tend to show a decline. For instance, more than 70% of countries with low levels of inequality during the 1990s now see inequality on the rise. This includes high-income countries in Europe and North America, as well as China, India, and Japan. At the same time, for roughly 82% of high-inequality countries the trend is toward greater equality. This applies to countries in sub-Saharan Africa, the Middle Eastern and Northern African region, and most of Latin American.
Nevertheless, there are exceptions. Inequality remained stable in high income countries such as France and the United Kingdom in the 2000s, and has fallen in Belgium, Portugal, and Switzerland. South Africa represents an exception where inequality continues to increase.
Figure 2: Change in Gini index for selected countries by income group.
It becomes clear that inequality neither has a uniform nor unidirectional trend. By identifying trends and also diversions thereof, new questions arise. What causes inequality to expand in one region or set of countries and not another? Can we generally verify cyclical tendencies as proposed by the Kuznet’s curve? What do political, economic, and social disruptions tell us about present consequences and trajectories? As inequality is a multidimensional phenomenon, attempts to understand its consequences and causes need to consider a wide array of political, economic, and social factors.
In an effort to contribute to income inequality data improvements, in the first half of 2021 UNU-WIDER will launch a companion to the WIID database that significantly improves the ease with which cross-country inequality trend comparisons can be made. These complimentary datasets provide researchers, policy makers, and advocates access to more integrated, harmonized inequality data on global and within-country income inequality, covering at least two-thirds of the global population since the 1980s.
By improving information that allows detecting trend patterns and diversions thereof more accurately, we can monitor progress towards SDG 10, reducing within- and between-country inequality. We can also set pathways for further explorations. These explorations can help us in identifying drivers and sources of inequality and, ultimately, finding answers and setting course towards more inclusive societies.
The views expressed in this piece are those of the author(s), and do not necessarily reflect the views of the Institute or the United Nations University, nor the programme/project donors.