 Join the network
Policy Brief
Horizontal inequality
Global trends and data challenges
Inequality—both vertical (between individuals and households) and horizontal (between groups)—is a core concern in the 2030 Agenda for Sustainable Development. However, despite considerable attention to horizontal inequality in both research and policy, there are notable gaps and weaknesses in our empirical knowledge about how it manifests within and across countries and over time. This has implications not only for the rigour with which we can build and test theories in this area, but also for informing policy, monitoring trends, and evaluating the impact of interventions.
In the last decades, developing countries have made great progress towards reducing poverty and vertical inequality. Available cross-national datasets suggest this also may be the case for horizontal inequality
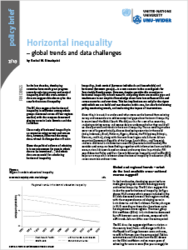
The EIC data suggest that horizontal inequality in education among ethnic groups decreased across all four regions studied, with the steepest downward sloping curve in Latin America and the Caribbean
Close study of horizontal inequality in 15 countries using survey and census data, however, illustrates the many data-related challenges that still exist
Given the political salience of ethnicity, it is not uncommon for gaps in ethnic data to be intentional -- and ethnic data are essential for calculating horizontal inequality
Given this, it is crucial to understand what more can be learned from existing survey and census data to address empirical gaps about horizontal inequality in countries of the Global South. We did just that for a set of 15 countries, analysing existing survey and census data to understand what they could tell us about patterns and trends in horizontal inequality. The 15 resulting studies cover ten of largest ethnically-diverse developing countries in the world (India, Indonesia, Brazil, Pakistan, Nigeria, Mexico, the Philippines, Ethiopia, Vietnam, and Iran), along with the next three largest sub-Saharan African countries (Democratic Republic of the Congo, South Africa, and Tanzania) and two additional Latin American countries (Guatemala and Ecuador). We consider and compare these findings together with information from available cross-national datasets based on census and survey data. In particular, FHI 360s Education Policy and Data Center’s Education Inequality and Conflict (EIC) helps us to map what is known about horizontal inequality in education (HI-E) across countries and over time.
Global and regional trends – what do the best available cross-national sources suggest?
In the last decades, developing countries have made great progress towards reducing poverty and vertical inequality. The EIC data suggest this is also the case for horizontal inequality. As Fig. 1 shows, HI-E among ethnic groups included in the EIC data decreased across all four regions studied, with the steepest downward sloping curve in Latin America and the Caribbean. Further, changes in HI-E according to these data have been quite heterogeneous across regions. The mean group Gini coefficient (GGini) in Latin America decreased by 71% between 1965 and 2005, compared with 23% in sub-Saharan Africa over the same period.

The EIC data also suggest significant variation at the country level, from a 5% change in HI-E in the Republic of Congo between 1965 and 2005, to 91% in Vietnam over the same period. Table 1 summarizes available data from the EIC dataset on the GGini coefficient and on mean years of schooling for 1965 to 2005 (five year average) for the 15 countries studied in our project. During this period the lowest change in HI-E among this set of countries was in Ethiopia, where it decreased by 6%. Nigeria and the Philippines also show comparatively low decreases.

In summary, the measures of HI-E compiled in the EIC dataset provide a useful guidepost, not only for thinking about global trends, but also for thinking comparatively across countries. But such figures also rely on sometimes problematic data and should be used with care as our country studies illustrate.
Persistent data challenges
Three sets of particularly problematic challenges in terms of survey and census data for ‘ethnic’ groups broadly defined were clear.
The first set of challenges are ‘methodological’ and largely particular to small minority populations. With normal sampling procedures, nationally representative surveys could miss such populations or provide insufficient data on them to produce representative samples. In practice, multiple ‘minority’ groups are often considered together in descriptive statistics and analysis. For instance, Vietnam officially has 54 ethnic groups, 53 of which each comprise less than 2% of the population (see Dang 2018). Many analyses thus consider ethnic divisions in terms of two groups, Kinh and ‘other’ (or ‘non-Kinh’). Treating such multiple ‘minority’ or ‘other’ groups as a single group is often the only practical option, and indeed is defensible in terms of group salience in many circumstances. However, such aggregate categories also obscure the diversity that may exist within them, and that diversity is sometimes significant.
A second set of issues stem from the conceptual challenge of capturing ethnic identities and groups. For one, there are multiple such groups in a society that have political, social, and economic salience. How do we decide where our attention should be focused? For instance, the groups that are salient in socio-political terms in the Philippines in fact differ from those enumerated in the census (see McDoom et al 2018). A related issue concerns how to interpret the data available—which can require considerable familiarity with the country context. One example is language data in Pakistan. The language in which a survey is conducted is often a good indicator of how the respondent identifies ethnically, but this is not generally the case for Urdu, the national language of Pakistan. One exception would be Urdu-speaking Muhajirs in Sindh province (see Majid and Memon 2017).
A third set of challenges stems from the political salience of ethnicity and the fact that data are political—and ethnic data can be especially so. Simple ethnic statistics can have implications for perceptions of power and for political manoeuvring among groups in and outside of government. In a majoritarian system, for instance, whether a group is 49 or 51% of the population can be extremely important.
Likewise, census and survey data, when publicly available, can be a powerful tool for social movement groups and other non-government actors and individuals. Governments might see such activity as a major risk in countries with significant histories of ethnic tension and conflict, and thus restrict the collection and/or public release of ethnic data. Likewise, particularly in situations of profound ethnic tension, respondents may be justifiably concerned when asked questions about ethnicity. In the United States during the Second World War, for instance, the Census Bureau provided the Secret Service with names and addresses of Japanese-Americans so they could be rounded up in internment camps.
Finally, the act of compiling such information, especially in official sources such as the census, could be—or could be seen as—nationally divisive. In Rwanda, for instance, where official ethnic identification was a major component of the genocide, the official line has become: ‘There is no ethnicity here. We are all Rwandan’.
More can be learned from rigorous re-examination of existing survey and census data and this can help to fill some empirical gaps – but not all
While discussion about the data revolution for sustainable development tends to highlight technical and financial constraints to better data, the hardest constraints—for ethnic data at least—are political
It is precisely in contexts in which ethnicity is politically salient that quantitative data on ethnicity may be unavailable or incomplete in important ways
These challenges imply both real limits in the data revolution for sustainable development and risks to evidence-based policy making in this area when it relies too heavily on quantitative data alone
In other words, given the political salience of ethnicity, it is not uncommon for gaps in ethnic data to be intentional. Given this, we can expect a lack of political will in some countries for filling data gaps in this area. While discussion about the data revolution for sustainable development tends to highlight technical and financial constraints to better data, the hardest constraints—for ethnic data at least—are political.
Another implication of this discussion is that it is precisely in contexts in which ethnicity is politically salient that quantitative data on ethnicity may be unavailable or incomplete in important ways. It is of course in such contexts that horizontal inequalities may pose the greatest risks and are thus most important for well-intentioned practitioners and policy-makers to somehow keep track of.