 Join the network
Blog
Updated Government Revenue Dataset provides new insights into developing country tax collection trends
The increasing focus on domestic resource mobilization in developing countries means that, for researchers and policy makers, access to accurate and timely data is more important than ever. The Government Revenue Dataset (GRD) — developed by the International Centre for Tax and Development and now maintained by UNU-WIDER — remains the most complete source of cross-country data available and has already been used extensively to address questions surrounding the impact of tax policy on development.
“Good policies require good research and good research requires good data”
The latest version of the GRD was launched at the beginning of July 2017. The dataset has undergone extensive revisions since the last version and so I’m here to provide a quick summary of what’s new. The GRD now contains data for over 190 countries, up to the year 2015. Fiscal data often lags 12–18 months behind the calendar year, so we have incorporated the most recent data available from the usual international sources. But in addition to just adding more observations, additional improvements have been made to enhance the consistency and accuracy of the data, along with improvements to accessibility for users. Indeed, in addition to adding data for 2013–15, we have also increased the total number of observations available for previous years, in particular for sub-components of total tax, such as income taxes, taxes on goods and services or trade taxes. But let’s start with a look at what the data itself reveals about revenue collection in recent years.
Data trends – the good and the bad news
 So what kind of trends can we see emerging in the data? Well, the news for many developing countries continues to be positive. In low-income countries, non-resource taxes have, on average, increased year-on-year in all but two years of the last decade. A similar upward trend can be seen for the average middle-income country. In LICs, the average amount of tax collected in 2015 was just over 14% of GDP — an average increase of almost 2% of GDP in just 5 years — quite impressive progress considering the relative stagnation of tax revenues in LICs in previous decades.
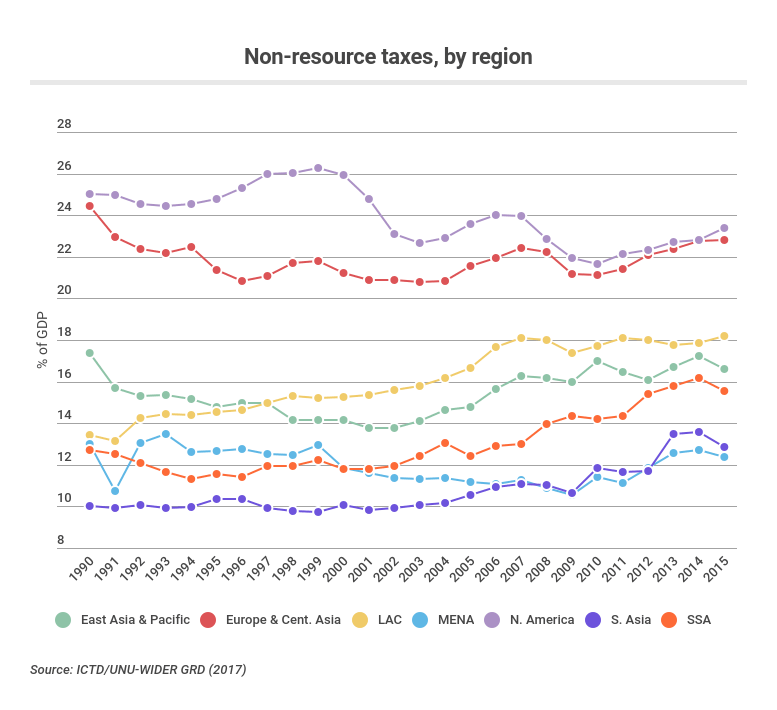 When we look at the tax ratio by region, there is also some good news. Sub-Saharan Africa — by far the world’s poorest region as measured by per capita GDP — is actually not doing too badly at collecting taxes, at compared to some other regions. On average, sub-Saharan African countries collect more than those in MENA or South Asia and, indeed, are catching up quickly with the East Asia and Pacific region.
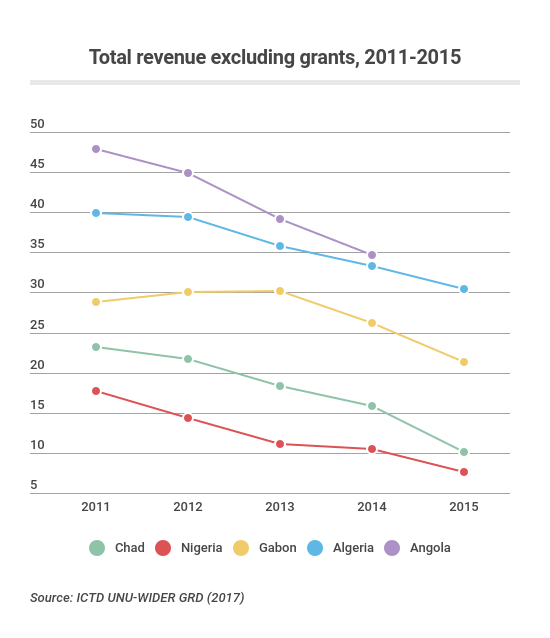
However, these largely positive trends mask a number of cases where countries have begun to grapple with lower revenues from both the end of the so-called commodities super-cycle and the oil price crash of mid/late 2014. For the first time in the GRD, we are able to examine the effects of these events on government revenues. The figure below, for example, illustrates this for a few African countries: it is clear that many of these have seen sharp declines in their government revenues over the past 5 years and will face revenue challenges in the coming years.
Large number of revisions makes the GRD easier to use and more consistent
All of the existing data has been checked for consistency and accuracy. In particular, a number of systematic changes have taken place. Detailed discussion of these issues can be found in a forthcoming discussion note/working paper which I am writing.
- Classification of VAT on imports. In earlier versions of the GRD, there were a small number of cases where the figure for taxes on international trade and transactions was inflated by the presence of VAT levied on imports; this was due to inconsistent recording of these revenues in the underlying sources — some countries reported them as a trade tax revenue, whilst others did so as a Goods and Services Tax (GST). I’m now pleased to say that this inconsistency has been ironed out, with VAT on imports being classed, correctly, as a GST in all cases. For a handful of countries where it was not possible to make the clarification, the disaggregated categories have been removed; no observations are preferable to those that are known to be incorrect. The concurrent adoption of the VAT and removal of trade tariffs is a familiar story in developing countries; the data now presents a clearer and more accurate view of the breakdown of indirect tax revenues between the two subcategories.
- The treatment of social security contributions (SSCs) is now more consistent across countries. This is particularly relevant for cases where the GRD draws revenue data from the central government level. Now only SSCs collected at the central government level are included here; whereas previously there were a number of cases where central government data included SSCs that were actually administered at the social security funds level of government. Researchers focusing on revenues at the central government level should now find a more consistent treatment here.
- As of 2014, the IMF reclassified taxes on financial and capital transactions as a GST, where it had previously fallen under the heading of property tax. This was done in order to bring tax statistics into line with how such transactions are recorded in national accounts. The GRD has now adopted this approach systematically, so all data now reflects this change, where possible, including data from sources such as the OECD Revenue Statistics, which continue to classify this item as a property tax. Whilst property taxes typically only comprise a small portion of total tax, as much as two thirds of this often came from taxes on financial and capital transactions. Thus, this reclassification might carry important implications for any research on property tax.
- The Notes and Caution Flags have been extensively revised and thoroughly overhauled. It is our hope that users find these more accessible and informative than before. There are now just three categories of Notes and Flags, corresponding to cases where there is concern about: (1) the accuracy or quality of an observation; (2) the treatment of natural resource revenues; and (3) the recording of social security contributions. The accompanying notes are now more visible in both the Excel and Stata versions of the GRD and I hope that users find the advice contained within useful for their analysis. The GRD has always striven to present the most accurate data possible and warning users of potential inconsistencies in the data — is an important part of the project.
We have also overhauled the look of the Excel files, which now show more clearly the sub-categories of revenue, whether they are inclusive or exclusive of grants, natural resource revenues, social contributions etc. I hope that users find the improvements to the GRD useful and continue to utilize the GRD in their research and analysis. As always, we are grateful for any feedback on the data and are keen to connect with researchers using the data. So, don’t hesitate to get in touch with any queries, comments or questions. A wide range of papers have already utilized the GRD to approach a number of interesting research questions and, with the continuing focus on domestic resource mobilization, we hope that the dataset continues to be a valuable tool to researchers.
The views expressed in this piece are those of the author(s), and do not necessarily reflect the views of the Institute or the United Nations University, nor the programme/project donors.