 Join the network
Blog
Lower exploration spending – another response to the end of the commodity price boom
My previous blog, which you can read here, commented on the manner in which mining companies had been able to respond to the recent decline in metals prices by significantly reducing their costs of production. In fact, this response arose partly from an exogenous event (lower energy prices), partly from an automatic stabiliser effect (lower royalty payments as production amounts and/or values were reduced) and partly from explicit action (reduction of labour forces and labour costs). The analysis was based on the very helpful materials presented by the ICMM in their recently published 3rd edition The Role of Mining in National Economies (hereafter RoMiNE3). This blog looks at another explicit action that was taken by most mining companies, both large and small, which is also analysed in RoMiNE3 — the reduction of spending on exploration and development.
A slow response followed by a major decline
Figure 1 below presents data for the 25 companies that were the largest spenders on exploration, research and development in 2011, and for 1,247 other companies for which the data are available. The analysis in RoMiNE3 was able to draw on the detailed company-by-company data made available by SNL Metal Economics [1]. It can be seen from those data that the exploration spend was initially slow to respond to the decline in metal prices from 2011/12. In fact, the total of such spending by the 1,270 companies shown in the figure actually rose to US$17.85 billion in 2012 as against US$15.16 billion in 2011; an increase of almost 18%.
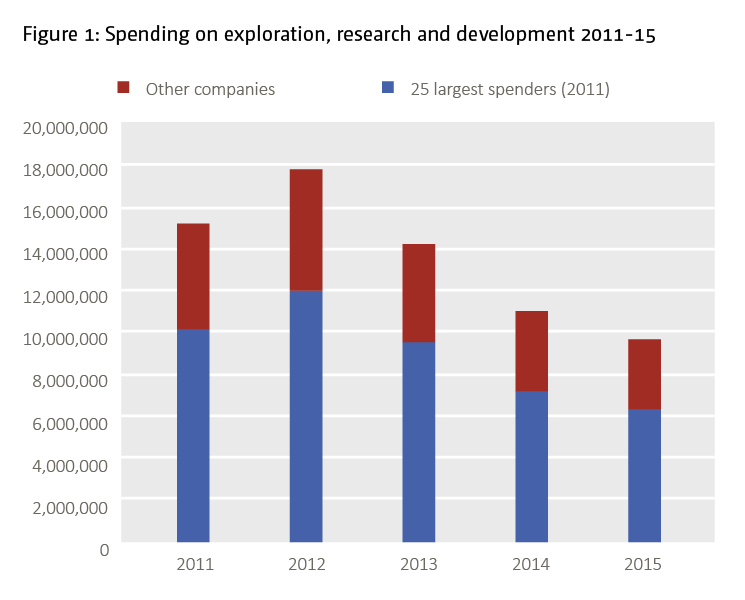
However, since 2012 there has been a major decline, with the spending of the top 25 companies falling by almost half between 2012-15; a fall from US$11.98 billion to only US$6.4 billion. There was a similar decline in the spend of the smaller companies; a decline of 45%. Taken together the two classes of companies took their exploration spending down by over US$8 billion over that three-year period.
Post-2016
But how has this situation evolved subsequent to 2016? A more recent report published by S&P Global Market Intelligence provides some useful answers. [3] First, their data which is based on the exploration budgets of 1,580 mining companies operating in non-ferrous metals, shows a further decline (in budgets not necessarily actual spending) in 2016 relative to 2015. The exploration budgets of these companies in 2016 was US$6.89 billion, [4] which implied a further drop of 21% over the 2015 level and is little more than one-third the level budgeted in 2012.
The longer-run data show an enormous increase in the total exploration budgets of the companies in the period from 2002 when the commodity price boom took off through 2008 when the global crisis temporarily interrupted this strong tendency — budgets in 2008 totalled US$13.75 billion as against only US$1.77 billion, a twelve-year low in 2002. 2011 and 2012 which coincided with the apex of the commodity price boom saw the highest ever levels of such exploration spending.
Is a recovery on the cards?
However the situation as between different companies has been mixed. For example, of the 1,748 companies that can be compared as between 2015 and 2016, 26% increased their budgets by more than US$100,000 over their 2015 levels of actual spending; 39% decreased their budgets by more than US$100,000 relative to 2015 actuals, and 35% changed budgets by US$100,000 or less. So, there is some limited sign of an upside to set against the general downward tendency. This possible shift in mood is also reflected in an upturn in 2016 in S&P Global’s Pipeline Activity Index (PAI). This index incorporates data on the number of projects where significant drill results have been announced, initial resource statements, new exploration financings and the attainment of positive project milestones
The PAI index rose from an end-2015 value of near 50[5] to a 44-month high of 84 in November 2016, after which it has declined only slightly. [6] This improvement seems likely to presage a stronger recovery of exploration spending in the near future — a prospect that is bolstered both by improving metals prices and a significant jump in the stock market capitalization of leading mining companies. The largest 25 companies by market capitalization saw an increase in that capitalization of 8% in the first quarter of 2017.
References
ICMM (2016). The role of mining in national economies (3rd edition). October. London: ICMM
S&P Global Market Intelligence (2017). Worldwide Mining Exploration Trends, March.
The views expressed in this piece are those of the author(s), and do not necessarily reflect the views of the Institute or the United Nations University, nor the programme/project donors.
[1] Later known as SNL Metals and Mining but then integrated into S&P Global Market Intelligence which also integrated several significant mining data bases including those of Perth-based Intierra, Stockholm-based Raw Materials Group, and Halifax-based Metals Economics Group.
[2] This is reproduced from Figure 9 in RoMiNE3 (2016) but the raw data came from the database created by the Raw Materials Group of Sweden that was at that time owned by SNL Mine Economics.
[3] S&P Global Market Intelligence (2017).
[4] Within this total, gold stayed as the most explored commodity in 2016, accounting for 48% of the global exploration budget in 2016.
[5] The all-time high reached at end-2011 was 130.
[6] Source: Julia Tilley and Sanjay Saraf, March 2017, accessed at http://marketintelligence.spglobal.com/our-thinking/ideas/mining-exploration-pipeline-activity-index-dips-despite-growing-optimism